
 |
Once the survey has launched all eyes are on the results. Are they in line with our expectations? Do revisions need to be made? How quickly are we getting N? What is the quality of the responses?
All of these questions can be answered on the Results tab.
Metric sub-tab
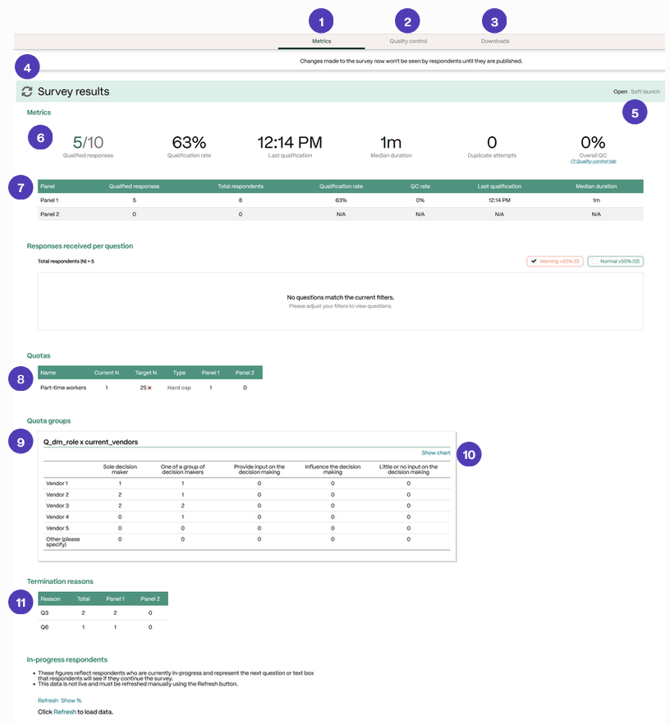 |
| #1 | Metrics sub-tab - Location for viewing metrics, quotas, and Termination reasons. |
| #2 | Quality control sub-tab - Location for viewing Qsponse metrics, weights for QC flags, and overall survey health. Can restatus respondents and view individual respondents |
| #3 | Downloads sub-tab - Location for downloading results table, answer key, question guides, and the analysis workbook |
| #4 | Refresh button - Note, results will update automatically. Click the refresh button to force an update. |
| #5 | Status and Phase indicators - The status is Closed or Open. The four phases are Authoring, Testing, Soft Launch, and Full Launch |
| #6 | Top-level metrics - quick view of the count of qualified respondents, total respondents, qualification rate, date of the last qualification, median duration (LOI), number of duplicate attempts, and overall QC % |
| #7 | Metric breakdown by panel - If your survey is using multiple panels, the top-level metrics will be shown here for each panel. |
| #8 | Quota Table - Here you will see the quotas that have been set up for your survey. Note this table can greatly expand depending on the number and type of quotas that are set up |
| #9 | Quota Groups - This section is shown if multi-dimensional quotas are being used. |
| #10 | Data/Chart toggle button - Use this to switch between data table and chart |
| #11 | Termination reasons - The reasons for termination are summarized here and broken down by panel |
Downloads sub-tab
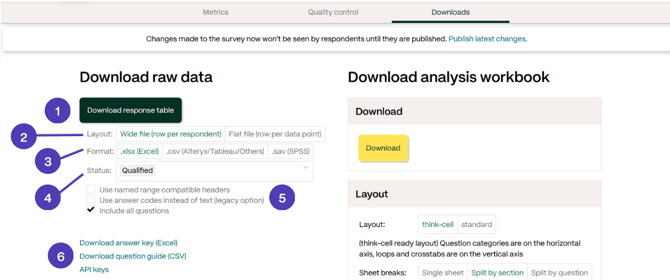 |
| #1 | Download button - Click here to download the latest version of the response table |
| #2 | Layout selector - Choose between Wide file (row per respondent) or Flat file (row per data point) |
| #3 | Format selector - Choose between Excel, CSV, or SAV (Wide file only) formats |
| #4 | Status selector - This dropdown selector will allow you to choose the type of data to download by respondent status |
| #5 | Download options - Use named range compatible headers, Use answer coded instead of text, or choose to download data from a subset of questions |
| #6 | Download buttons for the answer key and question guides. |
Quality Control
More information on the Quality Control tab can be found here: Overview: Quality Controls